How Texcel derives the reported Zero Crossing Results
Background
All of Texcel’s Blast Report Layouts display a table of results which include a number of results derived from a zero crossing analysis of the vibration waveforms:

These results are also reported in the Graph by Date and Time Spreadsheet reports.
Definition of Zero Crossing Frequency
AS2187.2-2006 (Explosives—Storage and use Part 2: Use of explosives) defines the Zero-crossing frequency under Definitions 1.4.41 as follows:
“The frequency calculated from the half-period associated with the zero crossings about an individual peak in a ground vibration or airblast time history.”
Under J4.4.3 Frequency dependent levels, AS2187.2-2006 goes on to say:
“It appears that the motion frequencies determined by simple methods, such as zero crossing, are conservative for assessing damage potential.”
Texcel Calculation of Zero Crossing Frequency
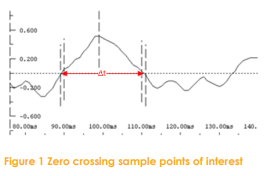
Figure 1 shows the sample points of interest for calculating Texcel Zero crossing results.

- The identified peak point in the waveform
- The points either side of the two zero crossings either side of the peak point.
The first step is to identify the actual time at which the waveform crosses zero.
■ Texcel calculates this by doing a linear interpolation between the points on either side of the zero cross, thereby significantly increasing the accuracy of the
frequency calculated.
The time between the two zero crossings (∆t) is the half-period of the frequency, which is then
calculated like this:
![]()
Acceleration and Displacement (Est. from PPV)
Texcel calculates an acceleration and displacement from the sample points of interest shown in Figure 1 above.
These numbers are labelled (Est. from PPV), because they cannot be construed to be an accurate measure of the peak acceleration or displacement in the waveform. To extract these numbers, the entire waveform must be integrated (to extract peak displacement) or differentiated (to extract peak acceleration).
These numbers are however a good indication of the ‘order of’ the acceleration and displacement measured.
■ You can use Texcel’s ViewW to integrate or differentiate a Texcel waveform.
Calculation of Acceleration and Displacement
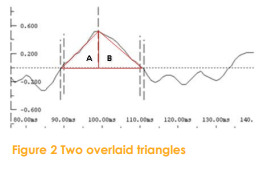
Because both the amplitude and time of the sample points shown in Figure 1 are known, the peak of interest can be overlaid by two triangles.
Calculating Acceleration
Because acceleration is the differentiation of the velocity waveform, an approximation of the acceleration at the peak can be derived from the slope of the hypotenuse of triangle A in Figure 2 as follows:


Calculating Displacement
Because displacement is the integration of the velocity waveform, it can be approximated by the sum of the areas of Triangles A and B. For an area calculation they can be assumed to be one large triangle, and the displacement can be derived as follows:

■ Because the displacements are usually very small, they are reported in µm
You can see how the displacement is derived from the peak and ZC peak frequency above as follows:
![]()
This will not always give exactly the same result, because the values are known more precisely than as displayed.
Because the base lengths (times) of Triangles A and B are not shown in the blast report, no ‘hand calculation’ of acceleration is possible from the reported results.
Further Assistance
If you need any further assistance, please contact Texcel:
Phone: +61-7-3237 8111
Email: team@texcel.com.au
